Your icon row is uneven, and the spacing is not the problem
You put eight 3D icons in a sidebar. Every box is 48 pixels, every gap is 16, and the inspector agrees. It still looks wrong. The settings gear reads small and timid next to the folder, which reads heavy and close. You nudge the margins, and nothing improves, because the margins were never the problem.
The difference is inside the files. A 512 pixel icon is not 512 pixels of artwork. It is artwork plus transparent margin, and the ratio between the two is different for every icon in every library we have looked at, including ours. We measured our own so we could stop guessing about it.
What we measured, and how
We took a spread sample of 60 icons from the Thridy API, every tenth entry across twelve pages spaced through the full list of 13,315 icons, then downloaded each display file from our CDN. For each file we read the alpha channel and counted a pixel as ink when its alpha was above 16 out of 255. That threshold does real work. 3D icons carry soft contact shadows that fade to nothing, and if you count a pixel at alpha 2 as part of the drawing, almost every icon appears to fill its frame and the measurement tells you nothing.
From the alpha mask we pulled two numbers. The ink box is the tight rectangle around everything visible, given as a share of the canvas. Visual mass is the share of the whole canvas that is opaque enough to see. The ink box drives apparent size. Visual mass is closer to apparent weight, which is why two icons can measure the same and still look unequal.
The frame is not the icon
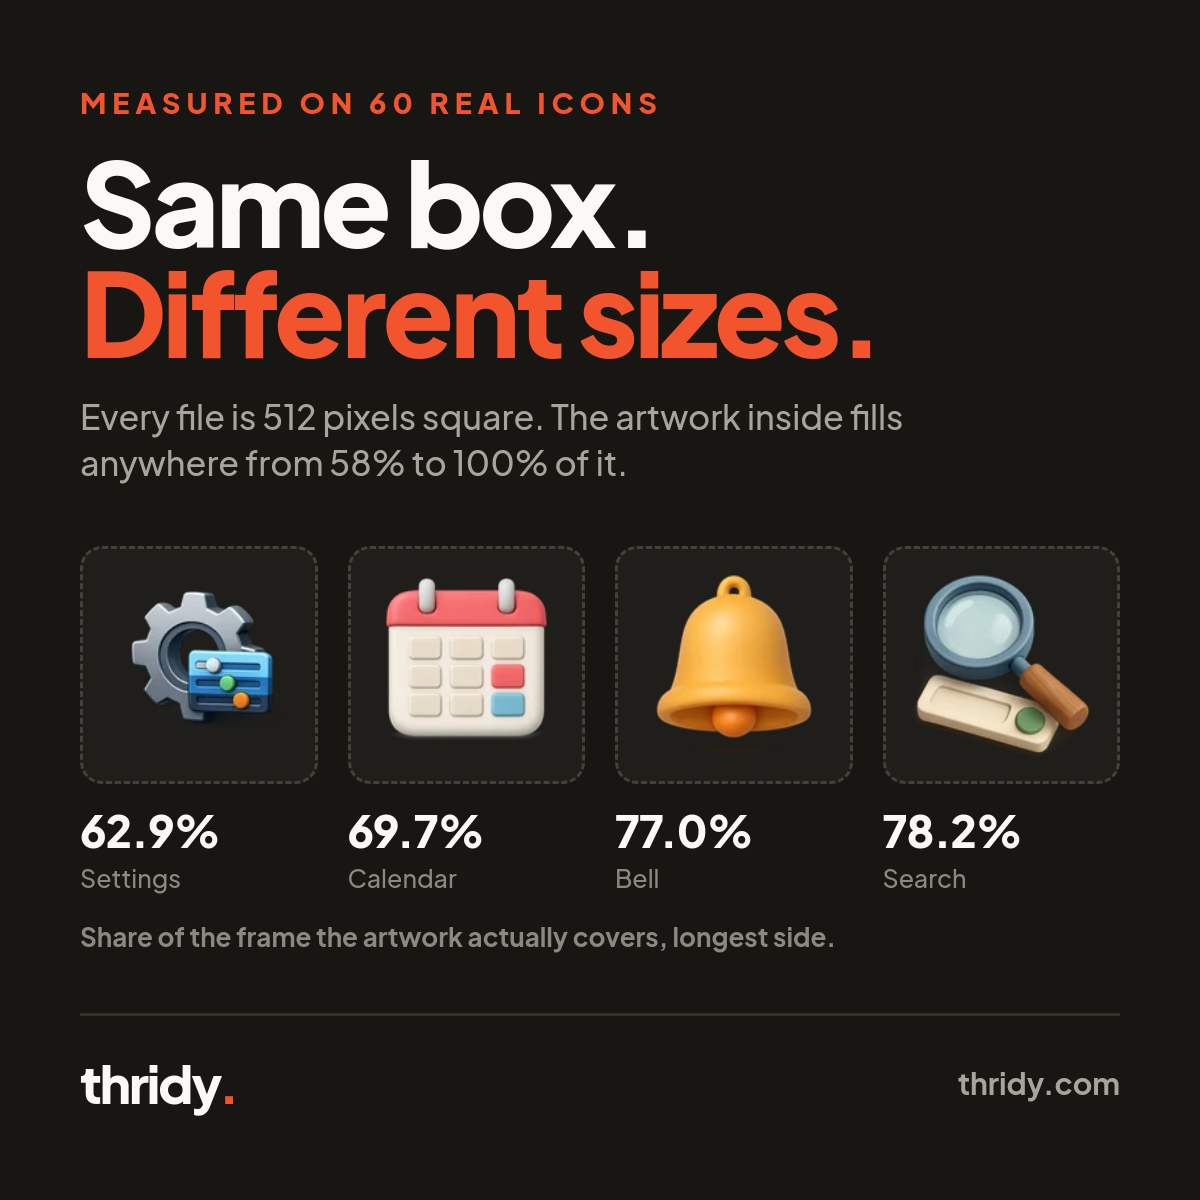
Across the 60 icons, the ink box on its longest side runs from 58.2% of the canvas to 100%. The median is 77.3%. So the same nominal size holds artwork that varies by 1.72x. Billiard Ball sits at 58.2%. Mazda MX-5 Miata reaches 93.9% and touches the frame. Two of the 60 run into the canvas edge with no margin at all.
Visual mass varies much more. The lightest icon in the sample, Utility Pole, covers 11.3% of its canvas. The densest, Urban Exploring, covers 51.9%. That is a 4.6x range in how much ink lands on screen, and it is why a thin object next to a solid one never balances no matter how carefully you set the box.
Vertical placement drifts too, though less than we expected. Median padding above the artwork is 15.8% of the canvas and below it is 18.6%, so the median icon sits slightly high in its frame. Weighting by alpha, the visual center of the artwork ranges from 39.5% to 58.7% of the height. In a 48 pixel box that is a swing of about nine pixels in where the eye thinks the middle is.
One more thing the files disagree on: nine of the 60 ship at 1024 by 1024 rather than 512. Nothing breaks, because CSS sizing overrides intrinsic dimensions, but the bytes do not disappear. Median weight for the 512 files in our sample was 32.5 KB against 142.8 KB for the 1024 files, roughly 4.4x, and the heaviest single file was 194.6 KB. If you are pulling display files straight into a nav bar, that is worth checking per icon rather than assuming.
Eight icons from a real dashboard
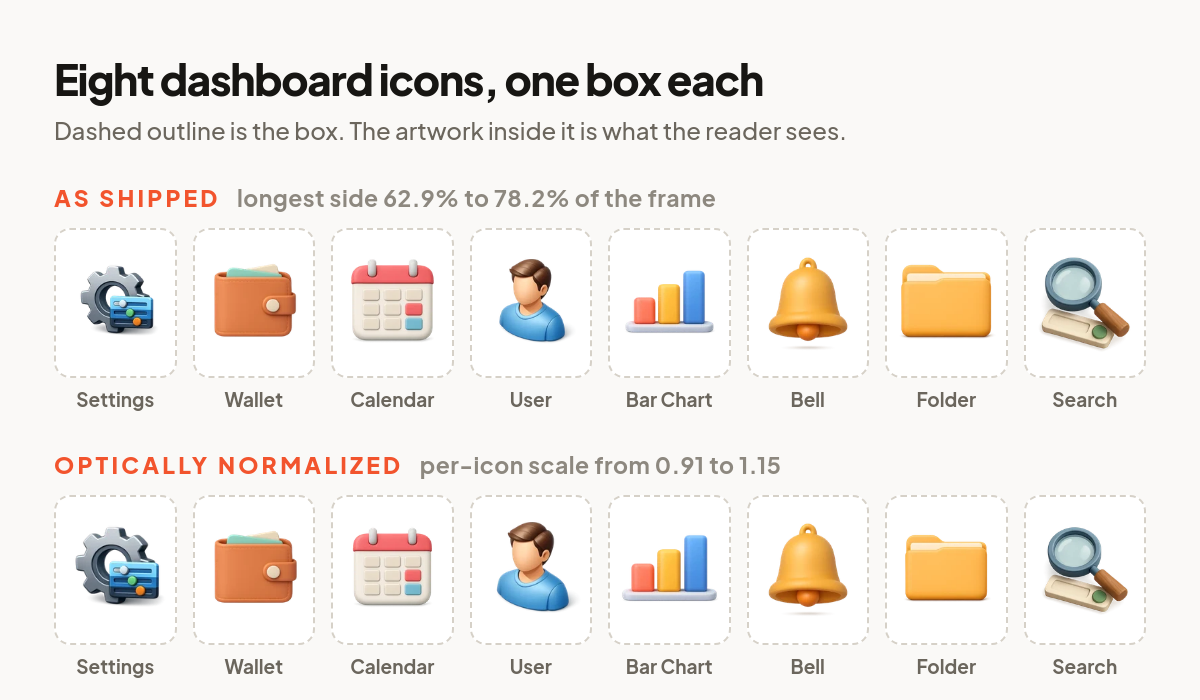
A random sample across an entire library overstates the problem, because you would never mix Utility Pole and Urban Exploring in one row. So we measured a set someone would actually ship together: Settings, Wallet, Calendar, User, Bar Chart, Bell, Folder, and Search Magnifier.
Even in that tidy set, the longest ink side runs from 62.9% for Settings to 78.2% for Search Magnifier. Put both in a 48 pixel box and the visible artwork is 30.2 pixels wide against 37.5 pixels. Seven pixels of difference, sitting side by side, at the size where the eye is most sensitive to it. Visual mass in that set spans 1.80x.
Why width and object-fit cannot fix this
The reflex is to reach for CSS. It does not reach far enough. MDN defines object-fit: contain as scaling the replaced content "to maintain its aspect ratio while fitting within the element's content box", so the entire object fills the box while preserving its ratio. The operative word is object. The browser works from the intrinsic dimensions of the image, and the transparent margin is part of those dimensions. As far as layout is concerned, the empty pixels are the picture.
The same applies to width, to aspect-ratio, and to any grid you build around the box. None of them can see the alpha channel. The correction has to come from measuring the pixels and then telling CSS what you found.
Two ways to normalize, and the one that surprised us
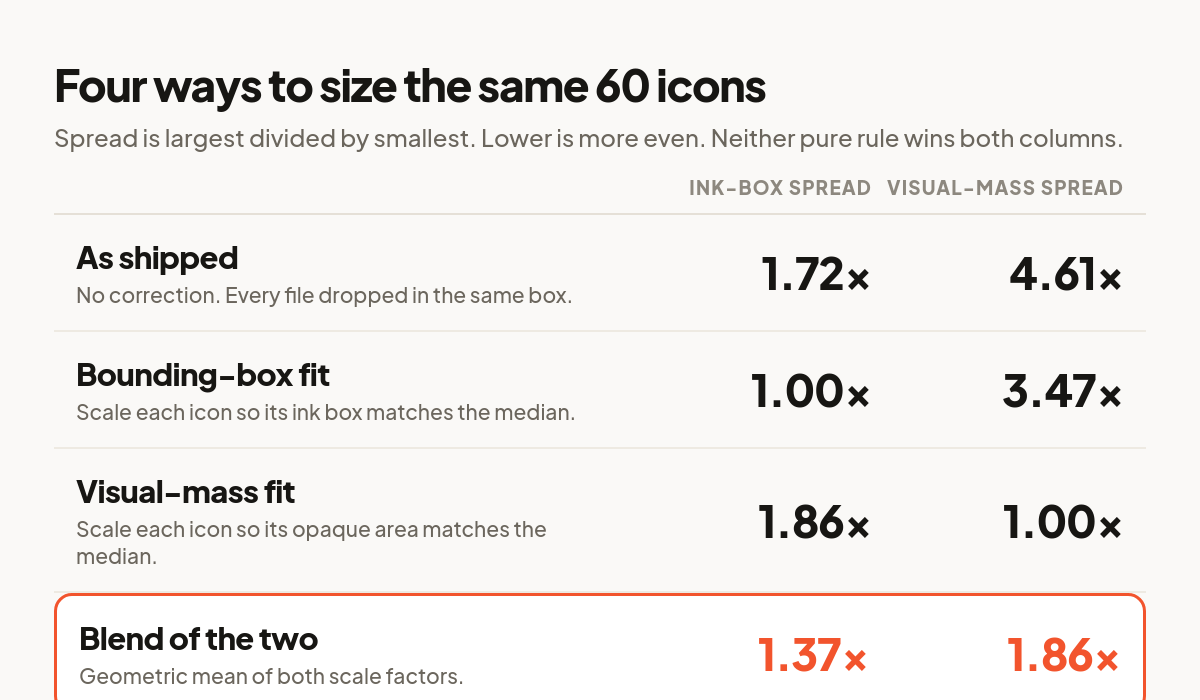
There are two obvious rules. Bounding-box fit scales each icon so its ink box matches the set median. Visual-mass fit scales each icon so its opaque area matches the set median. We ran both across the 60 icon sample and measured what happened to each metric.
Bounding-box fit does exactly what it promises: ink-box spread drops from 1.72x to 1.00x. It also drags visual-mass spread from 4.61x down to 3.47x, which is a bonus. Visual-mass fit is the mirror image: mass spread goes to 1.00x while ink-box spread rises from 1.72x to 1.86x, worse than doing nothing.
The result we did not expect showed up in the eight icon dashboard set. There, bounding-box fit made visual mass worse, from 1.80x to 2.08x. Settings has a small ink box and low density, so fitting the box scales it up by 1.15x and adds mass it did not need relative to Calendar, which is dense and already large. On a small, deliberately chosen set, the "obvious" fix can push you further from even.
Blending the two rules, by taking the geometric mean of the two scale factors, lands in a better place than either alone. On the 60 icon sample it gives 1.37x ink-box spread and 1.86x mass spread, down from 1.72x and 4.61x. On the dashboard set it gives 1.20x and 1.44x, improving both.
What we would actually ship
Measure once, at build time, not in the browser. Read the alpha channel of every icon in your set, store the ink box and the coverage next to the filename, and compute a per-icon scale factor from the median of that set. Then apply it as a plain transform: scale() on the image inside a fixed box, with overflow: hidden so an over-scaled icon cannot break the grid.
Two guardrails matter. Clamp the factor, roughly 0.85 to 1.20, because a large correction on a single odd icon reads as a mistake rather than a fix. And compute the median from the set you are actually shipping, not from the library. Icons only need to agree with their neighbors.
The other lever is cheaper and often enough on its own: pick icons whose silhouettes already agree. Our dashboard set spans 1.24x on the ink box before any correction, against 1.72x for a random draw from the whole library. Choosing well does most of the work that scaling would otherwise have to do.
Measure your own set
You do not need our numbers, you need yours, and the measurement is short. Draw each icon to an offscreen canvas at its natural size, call getImageData, walk every fourth byte to read alpha, and track two things in one pass: the minimum and maximum x and y where alpha exceeds 16, and a running count of pixels above that threshold. The first pair gives you the ink box, the count divided by total pixels gives you coverage. Run it over your set, take the medians, and divide.
Everything above came out of that loop. Nothing here is a rule of thumb about 3D icons in general. It is what 60 of our files and eight dashboard icons actually measured, which is the only kind of number worth designing against.
Free 3D icons for this
Every icon on Thridy is free to download and use. A few that fit this piece:
- Black Sesame Milkshake 3D icon
- Sesame Milkshake 3D icon
- Sesame Oil 3D icon
- Simit 3D icon
- Box Cheese Grater 3D icon
- Boxer 3D icon
Browse all 2,600+ free 3D icons or explore them by category.